Booking KPIs: which to measure and how to calculate them
13 October 2026

The essential KPIs for keeping bookings under control are occupancy rate, ADR, RevPAR, no-show rate and conversion by channel. We recommend pulling this data straight from your PMS and booking engine, and cross-checking it against your records of communication with customers. Measuring them consistently lets you adjust prices in time and cut the losses caused by no-shows.
In short:
- Every KPI should be tied to a goal, a repeatable formula and a person responsible for it; keep your dashboard to three to five indicators.
- Review inventory and sales daily, occupancy and rate trends weekly, and RevPAR, no-shows and conversion by channel monthly.
- In Europe, the rise in RevPAR was attributed mainly to higher ADR; adjust rates and segmentation rather than just chasing more occupancy.
- To reduce no-shows, send automatic reminders and ask for deposits in high season; in appointment-based businesses, empty slots cannot be recovered.
- Before comparing periods, remove duplicates, discount blocked rooms and record overbooking and last-minute cancellations separately.
Table of contents
- What a KPI is and why it matters in booking management
- The practical difference between metrics and KPIs: how to decide what to measure
- Key booking KPIs: formulas, examples and how to improve them
- How to measure: data sources and good practice
- How to choose and prioritise KPIs according to your business goal
- Dashboards, frequency and owners for booking KPIs
- Why ADR drove RevPAR in Europe
- Adapting KPIs to appointment-based businesses: hair salons, spas and physiotherapy centres
- The impact of automating WhatsApp bookings on your KPIs
- Combining booking KPIs with financial and satisfaction indicators
- Manage your appointments and reduce no-shows without wasting time on manual tasks
- Frequently asked questions
What a KPI is and why it matters in booking management
A booking KPI is an indicator you measure in order to make a specific decision, not a stray figure you file away in a spreadsheet. The difference lies in the purpose: any number can describe your business, but it only becomes a KPI when it is tied to a goal and an action.
For an indicator to work as a KPI you need three things: a clear formula you can repeat every week, a numerical target to aim for and a person responsible for reviewing it. Without these three elements, the figure remains a statistical curiosity.
In the accommodation sector, RevPAR (revenue per available room) and ADR (average daily rate) are the indicators that best connect price and occupancy, while your PMS (property management system) is usually the most reliable source for extracting them, because it brings bookings, rates and cancellations together in a single record.
Before setting up a dashboard, it is worth distinguishing the role each type of indicator plays:
- An operational KPI tells you whether you are meeting your day-to-day goal, such as occupancy for the current week.
- A financial KPI measures the economic result, such as RevPAR or average revenue per booking.
- A quality or experience KPI reflects how customers perceive your service, such as the cancellation rate or post-stay reviews.
The practical difference between metrics and KPIs: how to decide what to measure
Not every metric deserves to become a KPI, and treating every figure as if it were one only takes away your focus. Three criteria help you filter what to watch closely and what to leave as secondary information:
- Alignment with the goal: an indicator is only a KPI if it is directly linked to your priority for the quarter, whether that is revenue, occupancy or fewer no-shows.
- Ability to act: discard any figure you cannot act on; if you are not going to change anything when you see it, you do not need to review it every week.
- Data reliability: a KPI built on incomplete or poorly normalised data leads to wrong decisions, so prioritise consistent sources over eye-catching metrics.
A practical example: conversion by channel (how many visits to a particular channel end in a booking) is a useful marketing metric, but it only becomes a KPI when you set an overall conversion target and compare it period by period. Other metrics, such as average response time to enquiries or the number of visits to your booking page, deserve tracking even if they are not KPIs: they warn you of problems before they affect your main indicators.
Key booking KPIs: formulas, examples and how to improve them
These are the indicators that make the difference between managing bookings blindly and making decisions based on data.
Occupancy rate. It is calculated by dividing rooms sold by rooms available and multiplying by 100. If you sell some of the available rooms on a given night, you can calculate occupancy by dividing rooms sold by rooms available. To improve it, you can open flexible rates on low-demand days and run promotions aimed at last-minute stays.
ADR (average daily rate). It is the result of dividing room revenue by the number of rooms sold. If you generate revenue from rooms sold, your ADR is that revenue divided by the rooms sold. To raise it, segment rates by type of customer and work on upselling superior rooms or extra services in your booking engine.
RevPAR (revenue per available room). It is obtained by multiplying ADR by the occupancy rate, or by dividing total room revenue by rooms available. With a given ADR and occupancy rate, you can calculate RevPAR by multiplying the two values. It is the indicator that best sums up your overall performance, because it combines price and volume in a single figure.
No-show and cancellation rate. It is calculated by dividing the bookings not honoured (or cancelled) by the total number of confirmed bookings, multiplied by 100. The no-show rate is obtained by dividing no-shows by confirmed bookings and multiplying the result by 100. To reduce it, use automatic reminders before the appointment and require a deposit or advance payment for high-season bookings; you can also look at how to introduce advance payment without friction so you do it without losing bookings along the way.
Conversion by channel and lead time. Conversion is measured by dividing confirmed bookings by visits to each channel (your own website, OTA, phone or WhatsApp), multiplied by 100. Lead time is the average time between the first enquiry and the booking being confirmed. Channels with low conversion but long lead times usually need more sales follow-up before closing, while those with high conversion and short lead times are candidates for more investment in acquisition.
Average length of stay and revenue by channel. Average length of stay is calculated by dividing the total nights sold by the number of bookings. Knowing whether your longest bookings come through a particular channel helps you plan inventory and decide where to concentrate commissions or promotions.
A summary of the mechanics: with the rooms available and sold, revenue and bookings with no-shows, you can calculate occupancy, ADR, RevPAR and the no-show rate to assess the health of your business.
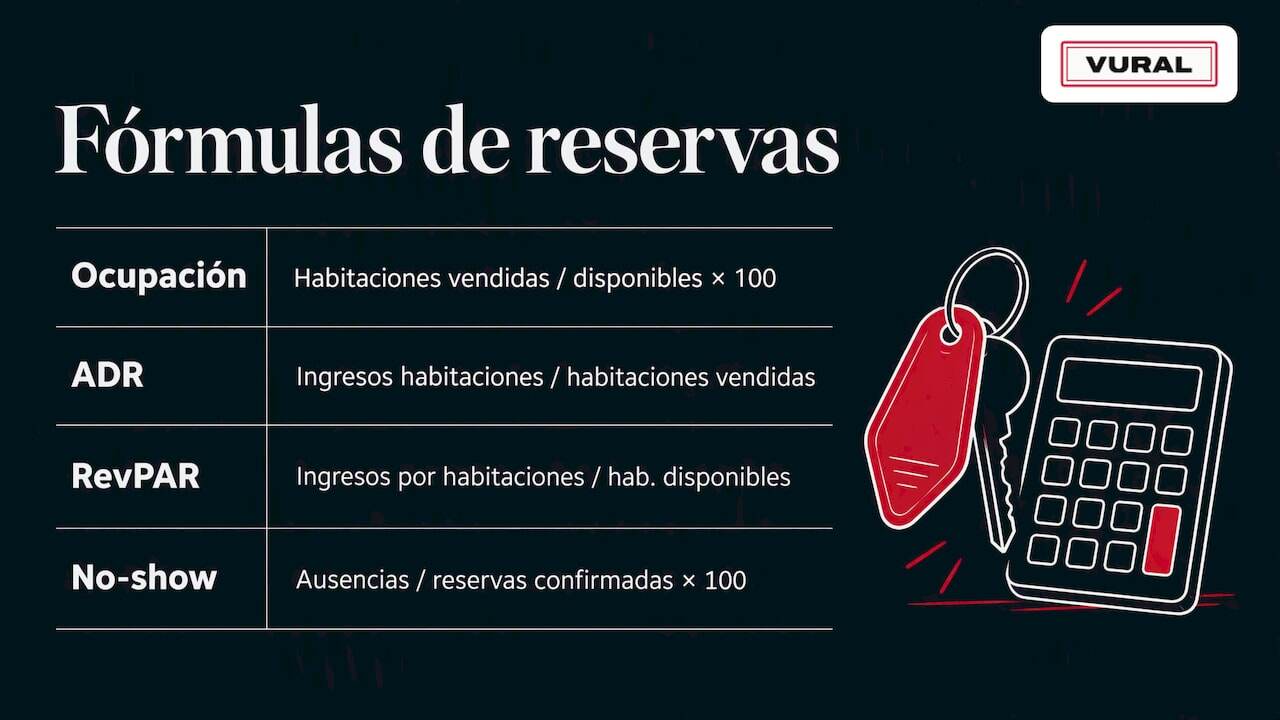
The sector report by HOTREC on the European market noted that in 2022 RevPAR growth in Europe was driven mainly by rising ADR, which underlines the importance of watching price as closely as occupancy.
How to measure: data sources and good practice
How reliable your KPIs are depends more on where you get the data than on the formulas you use. These are the usual sources:
- The PMS brings together rooms sold, rates applied and cancellations, and is the basis for calculating occupancy, ADR and RevPAR.
- The booking engine provides data on conversion and drop-off within the online purchase process.
- The channel manager shows how demand is split across distribution channels.
- The payment system records deposits, advance payments and refunds linked to cancellations.
- The CRM and WhatsApp records give context on enquiries, reminders sent and reasons for no-shows, something you can systematise if you automate WhatsApp bookings.
To make this data comparable between periods, clean out duplicates before calculating any KPI, always use the same time window (for example, the calendar month) and normalise figures by the rooms actually available, discounting those blocked for maintenance. Overbooking and last-minute cancellations should be recorded separately so they do not distort real occupancy.
How to choose and prioritise KPIs according to your business goal
You do not need to watch lots of indicators at once.
- If your goal is to maximise revenue, prioritise RevPAR and ADR, reviewed by whoever manages pricing or revenue.
- If your goal is to increase occupancy, prioritise occupancy rate and conversion by channel, overseen by the sales or reservations team.
- If your goal is to reduce losses from no-shows, prioritise the no-show rate and advance-payment metrics, handled by reception or whoever is in charge of bookings.
Each scenario calls for a minimal dashboard of three to five KPIs, no more: adding extra indicators only dilutes your focus without leading to better decisions. Review these priorities every quarter, because a goal that made sense in low season may stop being the most urgent one when demand changes.
Dashboards, frequency and owners for booking KPIs
How often you review a KPI determines whether it helps you act in time or merely documents what has already happened.
- Daily: review available inventory and the day's sales, ideally done by whoever runs reception or the booking engine.
- Weekly: analyse trends in occupancy, ADR and price changes against the competition, led by the revenue manager or the head of sales.
- Monthly: carry out a strategic review of RevPAR, no-shows and conversion by channel, with management involved to adjust the following quarter's targets.
The most useful format combines charts of occupancy against ADR, a table of revenue by channel and automatic alerts when a KPI strays from its target by more than a reasonable margin. That way you avoid checking every figure by hand and focus on the deviations that call for a real decision.
Why ADR drove RevPAR in Europe
The European market offers a useful lesson on where to put your focus. According to a 2022 MKG report published by HOTREC, RevPAR rose markedly in several European countries, driven mainly by increases in ADR rather than by improvements in occupancy.
For your business, this means that reviewing your pricing and customer segmentation strategy may have more impact on your revenue than focusing solely on filling more rooms. In practice: adjust rates by season and type of customer, review promotions that are eroding ADR without bringing in real occupancy, and keep an eye on the inventory you allocate to high-commission channels.
Adapting KPIs to appointment-based businesses: hair salons, spas and physiotherapy centres
The same principles of occupancy, price and no-shows apply to businesses that work by appointment, although the formulas change their unit. Instead of rooms, the indicator equivalent to occupancy is diary occupancy: slots booked divided by slots available in a day or week.
ADR translates into the average ticket per appointment, calculated by dividing the period's revenue by the number of appointments attended. The equivalent of RevPAR would be the average revenue per available diary hour, useful for comparing performance between professionals or between time slots.
The no-show rate is, if anything, even more critical in these businesses than in accommodation, because an unsold hairdressing or physiotherapy slot cannot be recovered through overbooking. Deposit policies and automatic reminders have a direct effect on monthly revenue. For businesses investing in equipment, such as Pilates studios or wellness centres, tools like an investment calculator for Pilates studios help put occupancy KPIs into financial context before deciding to expand.
The impact of automating WhatsApp bookings on your KPIs
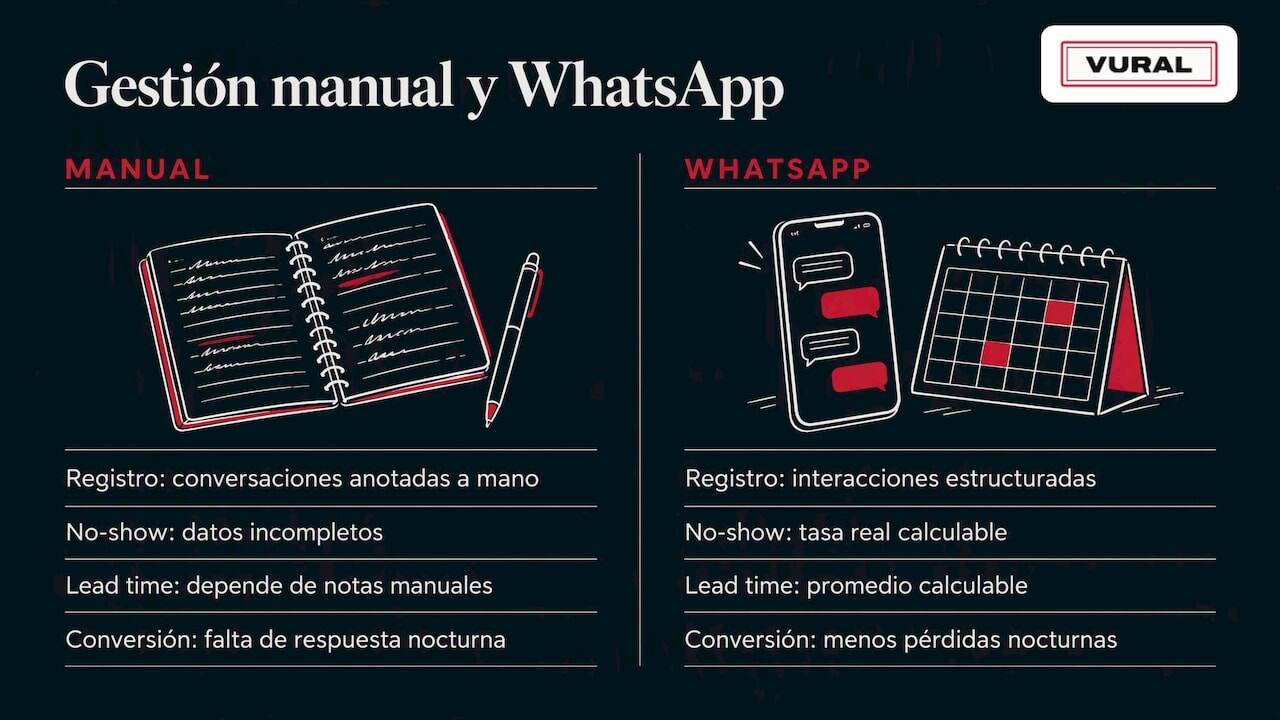
When bookings and confirmations are handled manually, data on no-shows, lead time and conversion by channel tends to be incomplete, because it depends on someone logging every conversation by hand. Automating that process on WhatsApp changes the quality of the data available, not just the speed of response.
An assistant that confirms appointments, sends reminders and handles cancellations directly on WhatsApp leaves a structured record of every interaction, which makes it easier to calculate the real no-show rate and the average lead time without relying on scattered notes. It also reduces losses from not replying outside working hours, a factor that directly affects conversion by channel when enquiries come in at night or at the weekend.
What is more, by centralising communication in a single channel, it becomes easier to cross-reference each customer's history with their previous appointments, which makes indicators such as visit frequency or the rate of recovered cancelled slots more reliable.
Combining booking KPIs with financial and satisfaction indicators
Booking KPIs make sense when they are read alongside financial and customer-experience indicators, not in isolation. A rising RevPAR that coincides with a drop in reviews or in the rate of returning customers usually suggests that price is growing at the expense of service.
To build that complete picture, cross-reference your occupancy and ADR with the period's operating margin and with satisfaction indicators such as the average review score or the customer repeat rate. A business with high occupancy but low repeat custom is probably sacrificing loyalty for volume, something worth correcting before it affects ADR in the medium term.
The joint review can be monthly, coinciding with the financial close: that way management assesses revenue, occupancy and satisfaction together, instead of reviewing each block separately and losing sight of how they relate.
Manage your appointments and reduce no-shows without wasting time on manual tasks
If you run an appointment-based business, such as a hair salon, a spa or a beauty centre, you probably already know that many of your KPIs (diary occupancy, no-show rate, average ticket) depend on how much control you have over the bookings that come in on WhatsApp outside your opening hours. At Vural we answer those enquiries, leave the appointment booked, let customers change or cancel it by message and, on the Pro and Premium plans, offer cancelled slots to the waiting list, without you having to keep an eye on your phone all day.
Our artificial intelligence learns your business's tone and vocabulary, respects the terms and prices you set, and brings your WhatsApp conversations with customers and your diary together in one place, avoiding the chaos of managing them separately. We charge no commission per booking and there is no tie-in: we set it up with your business's details, the set-up has a fixed price depending on the plan, and the monthly fee starts once it is working.
Have a look at the Inicial, Esencial, Pro and Premium plans and check the current terms at Vural.
Frequently asked questions
What are 5 recommendations for a hotel that wants to improve its KPIs?
Prioritise RevPAR and ADR if you are after revenue, automate reminders to reduce no-shows, review conversion by channel every week, normalise your data by the rooms actually available and keep your dashboard to between three and five key indicators.
What are the most important sales indicators for a booking-based business?
The most relevant are occupancy rate, ADR, RevPAR, no-show rate and conversion by channel, because together they describe volume, price and lost revenue. Calculating them with data from your PMS and booking engine avoids inconsistent figures between departments.
What are KPI ratios or indicators in booking management?
A KPI is an indicator linked to a specific goal and a possible action, not just a descriptive figure. In bookings, this means a figure such as occupancy is only a KPI when it has a defined target and someone responsible for acting on it.
What are the essential KPIs for an appointment-based business such as a restaurant or spa?
The equivalents are diary occupancy, average ticket per appointment or per cover, and the no-show rate, calculated on the same principles as hotel occupancy and ADR. Automating confirmations and reminders on WhatsApp makes this data more reliable by reducing no-shows.
Recommendations
More articles

13 October 2026
Appointment confirmation messages: ready-to-use templates
Use appointment confirmation messages with ready-made templates for WhatsApp and email. Get more replies, cut no-shows and adapt every text to your business.

12 October 2026
Advance payment for appointments: introduce it smoothly
Take payment for appointments in advance over WhatsApp: cut no-shows, forecast your income better and stop your team having to chase payments by hand.